
Against the backdrop of the COVID-19 pandemic, we’ve overhauled our annual ranking of B.C.’s best cities for work with an expanded list of 50 communities, a revamped methodology and a shift in focus away from work and toward broader economic health
When COVID-19 reached B.C.’s shores in early 2020—and society as we know it ground to a halt—the disease triggered the greatest public health crisis in living memory. Several months into the pandemic, we have a better sense of the risks to human health, but the longer-term impact on the economic health of our communities looks less certain.
“We are arguably in the single greatest socio-economic experiment in history,” says urban planner Andy Yan, director of the City Program at SFU. According to Yan, the pandemic is not only reshaping the economies of our cities but also reorganizing the human geography of our province. To help make sense of a dynamic and evolving situation, the seventh annual Best Cities for Work in B.C. survey consults several experts to reveal the pandemic’s uneven impact on industries and regions. The state of the tourism and real estate sectors and the shift to working from home figure prominently in their evaluation.
To gain further clarity and assess the ability of B.C.’s largest cities to weather the economic storm, we developed a new and expanded set of 12 indicators with help from research partner Environics Analytics. (For details, see “How We Crunched the Numbers,” below.) Covering demographic, workforce composition, real estate and employment trends, this year’s indicators explore key risk factors, resiliency factors and early signs of recovery.
A dichotomy emerges
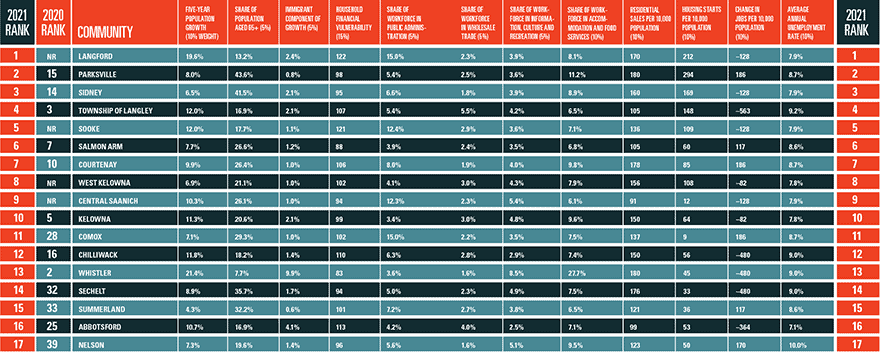
Thanks to a refreshed methodology, this year’s top cities look much different from 2020, yet much the same. Despite our new indicators, the Township of Langley (No. 4 this year), Salmon Arm (No. 6), Courtenay (No. 7) and Kelowna (No. 10) make a repeat showing in the top 10, underscoring their resiliency across a range of metrics.
With a more generous take on how we define “bedroom community”—appropriate, perhaps, given that more people than ever are working from home—four new cities join this year’s list and, coincidentally, the top 10: Langford (No. 1), Sooke (No. 5), West Kelowna (No. 8) and Central Saanich (No. 9). Rounding out the top three are Parksville (No. 2) and Sidney (No. 3), improving on last year’s solid showings of No. 15 and No. 14, respectively.
With six cities in the top 10, Vancouver Island has proven to be the most resilient region in the 2021 ranking. One secret to its success: a higher-than-average share of residents working in the public sector. This is especially true in the Capital Region, where the government employs more than 10 percent of the workforce in cities like Langford, Sooke, Central Saanich and Victoria. Martin Farnham, associate professor of economics at UVic, thinks this has helped to stabilize the region’s economy during the pandemic: “Thanks to the ability to run deficits, government employment is not as cyclical as the private sector.” But that’s not all the region has going for it.
The success of this year’s top cities also highlights an emerging trend, consistent with the observations of our experts: mid-pandemic conditions favoured smaller independent communities and suburbs over the central cities of B.C.’s largest metropolitan areas, such as Metro Vancouver and the Capital Region. “This is one thing that’s quite fascinating about this downturn—there are definitely regional differences,” notes Ken Peacock, chief economist at the Business Council of British Columbia. “There really is this churn and uneven impact.”
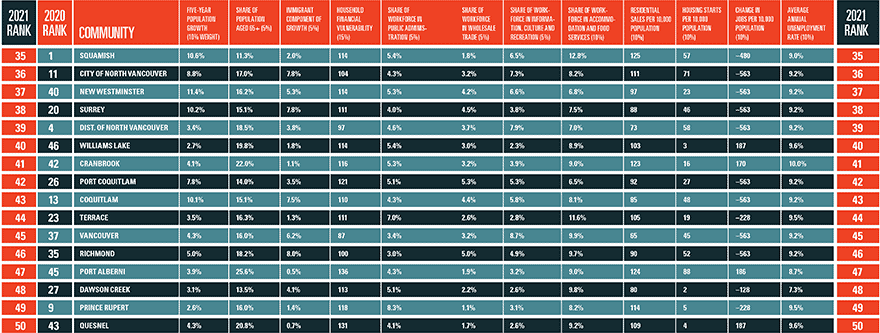
Comprising the bottom of the list is an incongruent mix of small resource-dependent communities and some of Metro Vancouver’s largest urban centres. Less surprising, perhaps, cities like Williams Lake (No. 40), Port Alberni (No. 47) and Quesnel (No. 50) continue to struggle against the long-term decline of the B.C. forest products industry. There are promising new signs of life for forestry, partly driven by a hot home renovation and construction market. But a sluggish global economy probably won’t do the industry any favours this year, Peacock reckons: “Growth at the global level is still expected to be a drag on B.C.’s export sector.”
One of the less anticipated outcomes of COVID-19 has been its lopsided impact on B.C.’s most urban areas. Surrey (No. 38), Vancouver (No. 45) and Richmond (No. 46) plunged to the bottom in the 2021 ranking. “If you think about the industry impacts from COVID-19, it makes sense,” Peacock says, citing the Vancouver region’s outsized reliance on tourism, hospitality and entertainment services, including large sporting events and a high concentration of bars and restaurants. Given the pandemic-combating restrictions placed on these activities early on, he isn’t surprised by the area’s performance. “The pain and the difficult challenges are going to be more concentrated in Metro Vancouver.”
Visitors wanted
B.C.’s tourism industry was hit hard by travel restrictions and the closing of international borders following the onset of the pandemic. “The impact of being an international destination has been devastating,” says Ingrid Jarrett, president and CEO of the British Columbia Hotel Association. “For the year of 2020, the occupancy we’re anticipating is somewhere around 30 to 32 percent. If we look at 2019, the whole province was sitting between 70 and 80 percent.”
The Resort Municipality of Whistler has felt the impact, with more than 35 percent of its workforce employed in the two sectors most affected by COVID: accommodation and food services and information, culture and recreation. It dropped to No. 13 after a multiyear stint at No. 2. However, Jarrett believes Whistler’s high-profile destination status and success at diversifying its year-round visitor experience has helped it avoid a worse outcome. “Certainly from 2019, they’re down from a revenue and an occupancy perspective, but they’re sitting at probably 65 percent of what they had last year, where other destinations would have been much lower than that.”
According to Jarrett, many of the trends seen in tourism mirror the results of this year’s ranking: “The urban centres—Victoria, Vancouver, Richmond—those are where we’re seeing the most severe impact and drop in tourism revenue.” While the province’s international destinations have seen a decline in visitors, other regions have benefited from an uptick in domestic travellers with nowhere else to go.
“We’ve had some areas that have had resiliency based on B.C. resident travel that have done quite well in the summer and into the fall,” Jarrett says. These include the Okanagan Valley, the Kootenays, Tofino-Ucluelet and the Parksville-to-Courtenay corridor. Jarrett attributes their success to comfortable climates, family-friendly amenities, and excellent outdoor and culinary experiences. It also helps, of course, that they’re traditionally less reliant on international visitors. “These areas that have done well, historically would have had less than 5 percent international travel, so their historical demand or travel pattern has not been disrupted, whereas in the rest of the province it has.”
Other positive signals for the industry include expectations for a strong ski season and higher- than-usual demand from grounded snowbirds over the winter. Still, the loss of international travellers can’t be understated. “They spend way, way more money than domestic travellers,” Peacock notes. “Even a big jump in domestic tourism can’t fill the hole that is left from the collapse in international tourism.” Jarrett’s take: “It will not replace the business that we’ve lost, and at the most it may keep the lights on for some hotels and accommodators.”
Back to work—slowly
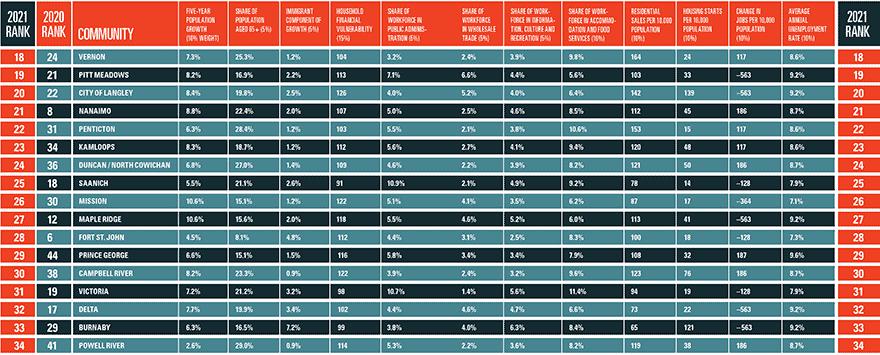
The province’s job market looked bleak over the spring of 2020. Unemployment rates roughly tripled from historic lows, reaching as high as 16 percent in the Kootenays in June. The summer months saw numbers rebound as most regions dipped back under 10 percent by September. The Northeast communities of Fort St. John (No. 28) and Dawson Creek (No. 48) led the pack heading into the fall.
Peacock highlights a recurring theme: “Most of the job losses are in the Metro Vancouver area.” Not including the province’s other major metros—Victoria, Kelowna and Abbotsford—”the number of people working in that rest-of-B.C., small-town aggregate is up from February,” he reveals. Metro Vancouver’s slower employment recovery has contributed to the weaker showing of its municipalities in this year’s ranking, as captured by our change in jobs and unemployment rate indicators.
On a cheerier note, even in Metro Vancouver there are some positive employment trends. Wholesale trade, the first industry to regain and exceed pre-pandemic employment, is most heavily concentrated in the Lower Mainland. That’s helped keep communities like Abbotsford (No. 16), Pitt Meadows (No. 19), the City of Langley (No. 20), Mission (No. 26) and Maple Ridge (No. 27) competitively placed in this year’s list.
The film industry is another area of promise, Peacock says. After being shut down early in the pandemic, film and television production is a massive growth industry that has played an important role in Metro Vancouver’s employment recovery into the fall, he believes. “I’ve talked to people in cities that do the permits and stuff for shooting, and they said it’s super, super busy over the past couple of months.”
The IT factor
Many international technology companies have benefited from the pandemic—Zoom is a prime example—so it’s hardly shocking that the tech industry has been another bright spot for Metro Vancouver. Most notable is Amazon’s September announcement that it would add 3,000 jobs and absorb more office space in downtown Vancouver.
Greg Malpass, founder and CEO of Burnaby-based Traction on Demand, a large consulting partner and app developer for the popular online sales platform Salesforce, is quick to point out the bigger picture. “The truth is, local industry has created way more jobs than Amazon has,” says Malpass, citing Traction on Demand’s plans to hire hundreds of people in the province over the next year alone. B.C.-based tech companies also help generate more high-quality, senior positions than international satellite offices, Malpass adds.
He partly attributes the industry’s growth through the pandemic to the digital transformation of organizations in non-technology industries, which have been busy cleaning up old systems and processes. “That’s resulted in an increased appetite in purchasing technology and applying it to their businesses and getting ready for what the next economy is going to look like.” Further supporting the growth of tech in B.C. is what Malpass describes as a convergence of related sectors creating an innovative tech ecosystem. “You’re starting to see the gaming, film and data worlds kind of all smashing together.”
As tech remains buoyant, Traction on Demand is one example of a homegrown firm looking to expand its footprint. After opening a Nelson office in 2019, the company has its eye on other smaller B.C. cities—the Vernon and Duncan areas among them. “We’re looking at where the next towns are,” Malpass says. “One thing I’m watching is the median age in these towns. Where are the young towns? Where is the bulk of capability?”
Proximity to postsecondary institutions is another important factor for Malpass. “It makes a big difference, especially when you think about Victoria and the Island. UVic, Camosun—those colleges are so accessible.” He’s also interested in following talented workers who have relocated to smaller towns in recent years. High housing prices in Metro Vancouver have been a factor, but so have things like the convenience of shorter commute times and a desire for a stronger sense of community. “They’ve moved there because they want a better sense of identity within a community,” Malpass says, “[to] feel safer, more connected.”
Small is beautiful
This shift to small-town living has been a trend for several years, Peacock observes. “It was clear that people were already moving out [of Metro Vancouver]—and I would argue because of high housing costs—at a rate of about three times of what I would describe as normal.” But with so many people now working from home and no longer anchored to their places of work, he thinks the pandemic may be accelerating this trend. “Going virtual was already evident, but [COVID] has just supercharged it. Same thing with some of these migration patterns.”
Brendon Ogmundson, chief economist with the British Columbia Real Estate Association, agrees, citing a large uptick in single-family home sales in Victoria and the Okanagan through 2020. He also believes the pandemic is driving demand for larger living spaces, which come at a premium in Metro Vancouver. “If you are going to be largely housebound for several months, or if you can now work remotely, it makes sense that you might want more space for a home office or a yard to do socially distanced entertaining.”
Data from BC Assessment confirms Ogmundson’s observations. The top markets for residential sales through the first three quarters of 2020, relative to their population size, were (in order) Parksville, Whistler, Courtenay, Sechelt, Langford, Vernon, Sidney, West Kelowna, Penticton and Kelowna. The least active markets: Vancouver, Burnaby, the District of North Vancouver, Delta, Saanich, Dawson Creek, Coquitlam, Mission, Surrey and Richmond.
A similar trend could be seen with housing starts, or the number of new homes being built. The busiest cities: Parksville, Langford, Sidney, the Township of Langley, the City of Langley, Burnaby, Sooke, West Kelowna, Port Alberni and Courtenay. Markets with the least construction activity: Dawson Creek, Williams Lake, Quesnel, Prince Rupert, Comox, Central Saanich, Saanich, Penticton, Cranbrook and Mission.
The housing markets with the greatest demand include some of the province’s youngest cities, like Langford, where families are finding some of the most affordable housing in an increasingly expensive Capital Region. But retirees looking to relocate also appear to be driving demand in cities such as Parksville, Sidney and Sechelt, which have the highest share of seniors in the province. “An aging populace is going to mean traditional retirement communities see an influx,” Ogmundson notes.
Families in search of affordability also appear to be fuelling the market dynamics of the Lower Mainland. Here, sales have been highest in demographically young communities outside the core cities of Metro Vancouver, including Chilliwack, Squamish, Maple Ridge and the Langleys. By comparison, cities like Vancouver, Richmond, Burnaby and Surrey have relied more heavily on new international residents to fuel growth in recent years. A COVID-induced slowdown in immigration could hinder their growth, but may also improve their affordability for local buyers.
In general, the real estate sector’s resilience during the pandemic has been surprising. “Looking at recent data in the housing market, it would be difficult to tell there was a recession at all,” Ogmundson says. “The COVID-19 recession, however, has been anything but typical.”
With so many people having lost jobs or seen work hours reduced, what’s underpinning the demand for new homes? A mix of low interest rates and government financial supports means homebuying remains a viable option, at least for some, says SFU’s Yan. “The population that was in a position to purchase a home was probably the one that was not as affected as the population that were already on the sidelines of the housing market prior to COVID-19.” In other words, the pandemic has hit lower-income hospitality workers harder than higher-income employees in professional services, who could more easily transition to working from home. Yet Yan stresses: “The comment is for now there are certain sectors of the economy that have been hit much harder than others.”
Looking ahead
As we stand at one of the most pivotal socio-economic junctures of the past century, forecasting how 2021 will unfold is anyone’s guess. Among our experts, there’s a sense that the worst of the economic fallout may still lie ahead.
Their concerns are wide-ranging, from the pandemic’s impact on employee mental health to reduced face-to-face interaction, which limits opportunities for collaborative innovation. Then there’s the tough balancing act for senior governments as they try to keep the economy afloat with stimulus spending and financial supports for businesses and workers. “Somehow these policy makers are walking this very difficult line, and I don’t want to for a second pretend that that’s easy,” the BCBC‘s Peacock says. “We just don’t want to end up in a circumstance where you have a bunch of companies that are depending on these handouts to survive.”
If Malpass’s earlier valuation of college towns is any indication, cities with a major postsecondary institution may be better positioned to ride out the economic uncertainty than others. UVic’s Farnham agrees: “Demand for a university degree often goes up during economic downturns because job prospects are poor.”
For local governments, rethinking development fees and permit processes should be a priority, according to Peacock. “I would be looking to streamline and process as many of the development permit applications that I currently had as possible, because the residential construction industry is a major economic engine in British Columbia.”
With people spending more time in and around their homes and less time frequenting traditional employment hubs, SFU‘s Yan believes cities need to start retrofitting their residential areas for a greater mix of uses. In particular, he suggests introducing functions of production, consumption and distribution. “The future is about how you can build spaces and cities and neighbourhoods that can adapt to and be flexible to those three functions.” One recent example cited by Yan is the transformation of Surrey’s Cloverdale Fairgrounds into a television production set. He commends reusing the space, which has seen events cancelled during COVID, to bring new types of jobs to the area.
Taking the long view of what will happen in a post-COVID world, Yan believes stability will be a key asset for the province as a whole. “I think underlying recovery is the level of stability that we have,” he says, “the political, economic and social stability that you can find in British Columbia that you may not necessarily find in other places in the world.” This foundation will ultimately be what attracts new residents, businesses and capital, Yan predicts. “The attraction isn’t the return on investment,” he says, pointedly. “It’s the return of investment.”
Just So You Know…
Our ranking only includes cities of 10,000 or more permanent residents.
We excluded bedroom communities like Lake Country, Oak Bay and West Vancouver, which may offer a high quality of life but have small job markets.
Langley and North Vancouver are represented on the ranking by both their city and district municipalities.
Although we use the term “city” throughout, our annual survey is technically a ranking of municipalities, as legally defined by the B.C. Local Government Act.
We work with research partner Environics Analytics because we believe it has the best data availablebut even that has limitations. To produce municipal-level population growth numbers, for example, the firm used regional-level estimates from Statistics Canada to make 2020 projections.
Job numbers and unemployment rates come from StatCan’s monthly Labour Force Survey and only present figures for B.C.’s eight economic regions and four census metropolitan areas for the first three quarters of 2020. Similarly, monthly housing starts figures provided by Canada Mortgage and Housing Corp. and quarterly residential sales figures from BC Assessment only reflect the year-to-date figures collected to the end of September. As such, those indicators won’t account for economic trends over the final quarter of 2020.
How We Crunched the Numbers
To determine the most economically resilient cities in B.C., we examined 12 economic indicators with weightings ranging from 5 to 15 percent, including two carried over from last year’s Best Cities for Work ranking and 10 new ones. The weightings strike a balance between demographic- and workforce-related indicators, which include pre-pandemic risk and resiliency factors, and those tracking aspects of 2020 economic recovery, like housing starts and unemployment rates. Each city received a score out of 100 points and is ranked accordingly.
Five-year population growth (maximum score of 10 points)
This figure represents the population growth for each city from 2015 to 2020. We gave the highest-growth city 10 points and scored the others in proportion to that.
Share of population aged 65 and over (5 points)
This value represents the share of a city’s total population aged 65 and older. Given that the pandemic poses a higher health risk to older people, we assumed that cities with a larger proportion of seniors would similarly be at greater economic risk. The city with the lowest share of seniors received a score of 5, with the others scoring in inverse proportion.
Immigrant component of growth (5 points)
This number reflects the segment of five-year population growth composed of international immigrants, as reported by Statistics Canada for 2016, the most recent census period. Knowing that the pandemic has curtailed international immigration to Canada, we assumed greater economic risk for those cities most reliant on immigrants for growth. Again, the city with the lowest value received five points, with the others scoring accordingly.
Household financial vulnerability (15 points)
This figurean index created by research partner Environics Analyticslooks at a range of household financial variables, including debt, liquid assets and discretionary income, to show how precarious a typical household’s finances are in a given city. The higher the index value, the more vulnerable a city’s households are on average. Therefore, we gave the lowest value 15 points and scored the others in relation to that.
Share of workforce in public administration (5 points)
This indicator reflects the proportion of a city’s workforce employed in the industry that StatCan identified as least affected by COVID-19. The community with the highest share of its residents in public administrationas defined by the North American Industry Classification System (NAICS)received 5 points, and we evaluated the others in relation to it.
Share of workforce in wholesale trade (5 points)
One of the industries least impacted by the pandemic, wholesale trade was the first to see employment recover and exceed pre-COVID levels. Giving the city with the highest share of workers from this sector a 5, we scored the others in proportion to that.
Share of workforce in information, culture and recreation (5 points)
To represent the second-most COVID-afflicted industry, we gave the city with the lowest share of its workforce employed in information, culture and recreation five points, with the others ranking accordingly.
Share of workforce in accommodation and food services (10 points)
Hit harder by the pandemic than any other industry, accommodation and food services employs twice the workforce of the above sectors, on average, so we weighted it accordingly. The lowest value received a score of 10, with the other cities scoring in inverse proportion.
Residential sales per 10,000 residents (10 points)
This number, from quarterly BC Assessment data, reflects the year-to-date sales totals for single-family and strata residential properties to the end of September 2020. After dividing sales totals by total city population, we multiplied that figure by 10,000 to determine the number of sales per 10,000 residents. We gave the highest value 10 points and scored the others accordingly.
Housing starts per 10,000 residents (10 points)
We derived this value from the year-to-date housing starts from Canada Mortgage and Housing Corp.’s monthly Starts and Completions Survey to the end of September 2020. The city with the highest number of housing starts per 10,000 residents received a score of 10, with the other cities scoring in relation to that.
Change in jobs per 10,000 residents (10 points)
This figure measures the change in the employed labour force from January to September 2020, derived from StatCan’s monthly Labour Force Survey. We scored the year-to-date difference in jobs out of a maximum value of 10.
Average annual unemployment rate (10 points)
For this indicator, we averaged unemployment rates for each city from the first three quarters of the year. The averages were derived from rates reported in StatCan’s monthly Labour Force Survey for January through September 2020. We gave the lowest average 10 points and evaluated the others in relation to that.