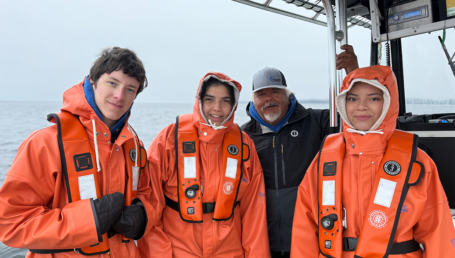
Our annual ranking of the province’s best cities for working people turns four with an accent on quality of life. Plus: we take an insider tour of frontrunner Dawson Creek and check in with three young residents of fast-growing Campbell River
What are British Columbia’s top places to build a career? Start by following the money, but that isn’t the whole story. In our fourth annual Best Cities for Work in B.C. ranking, compiled with research partner Environics Analytics, we measure a city’s attractiveness as a place to work by putting a two-thirds weighting on how much residents earn and where income is heading. We use the seven economic indicators from the previous survey: average household income, household income for primary earners under age 35, average household spending on recreation, average shelter costs, five-year population growth, five-year income growth and unemployment rate.
Northeast oil-and-gas powerhouses Fort St. John and Dawson Creek return to the top three, with the former taking the lead from Squamish (No. 3 this year) and the latter climbing to No. 2. Lower Mainland residents might find those communities’ staying power surprising, given the persistent slump in fossil fuel prices and last summer’s cancellation of the Pacific NorthWest liquefied natural gas megaproject. But anyone who’s visited Dawson Creek (see page 32) knows that the city is contending with a boom fuelled by multibillion-dollar investment in oil and gas extraction and infrastructure.
 This year, to better gauge quality of life, we also take into account how many people walk or bike to work—arguably a better yardstick than the number who use public transit. “The issue with mass transit is that it’s not going to be available in all cities,” says Peter Miron, Toronto-based vice-president, demographic and economic data, with Environics Analytics. “Walking and bicycling to work are enjoyable activities,” Miron adds. “Mass transit might be cheap, but it’s not necessarily adding to your enjoyment of life.”
When it comes to walking and biking, you’d think urban centres like Vancouver would have an edge. But our three top cities—all relatively small communities—did well in that category, too. “You’ve got a very strong accessibility factor, but it’s almost picking up not necessarily urbanity as much as quaintness,” Miron notes.
He warns against fixating on unemployment rates, which have dropped in most B.C. regions as the province builds on its strong economic performance in 2016. “If you see an area with very a low unemployment rate, it could be because everyone’s got a job,” Miron says. “But it could also mean that everyone who doesn’t have a job has now been so discouraged looking for work that they’re no longer in the labour force.”
Although the ranking shows where our 36 cities placed last year, those that climbed or fell shouldn’t make too much of it—and not just because we tweaked the methodology. As Miron explains, the data sets his firm uses get updated from year to year, sometimes leading to revisions of historical numbers. In any case, “the difference between middle cities is quite slim,” he says. For those communities, a small change in, say, five-year income growth can make a big difference in ranking order.
By the same standard, where they fetch up on the list won’t be the deciding factor for anyone weighing where to move, Miron reckons. “At that point, it’s probably a choice between the attributes that we haven’t got in the study: the charm of Campbell River, and the fact that Vernon happens to be next to a beautiful ski resort,” he says. “But whether or not you want to move there is going to be based more upon personal preference. There’s no bad choice.”
 Just so you know:
Our ranking only includes cities with more than 10,000 permanent residents.
Bedroom communities may be great places to live, but they have relatively small job markets. For that reason, we excluded cities like Port Moody, White Rock and West Vancouver.
For Langley and North Vancouver, we combined the numbers for city/town and district governments.
We work with research partner Environics Analytics because we think it has the best available data, but there are limits. For example, to produce its income numbers, Environics Analytics uses Statistics Canada and Canada Revenue Agency data projected forward to 2017. The unemployment rates shown in the ranking are from Statscan’s September 2017 Labour Force Survey, a three-month moving average that only calculates numbers for the province’s seven economic regions and won’t reflect any changes for the rest of the year.
How We Crunched the Numbers
To compile the B.C.’s Best Cities for Work ranking, we considered seven economic indicators, giving them a variety of weightings. This year’s methodology also includes an eighth indicator that speaks to quality of life: the proportion of residents who walk or bike to work. We didn’t factor in people who use public transit to get to their jobs because it would give an unfair advantage to Vancouver and other cities with extensive transit systems.
Average household income (10% of total score)
This figure represents the average for 2017. To determine a score out of 10, we gave the top average income 10 points and ranked the other cities in relation to that.
Average household income under 35 (10%)
This number represents the 2017 average household income for primary income earners under the age of 35. Again, we gave the highest average 10 points and ranked other communities accordingly.
Average household spending on recreation (10%)
Boats, cable bills, concert tickets, vacations—this tally encompasses all leisure-enhancing household purchases that Statistics Canada tracks. Giving the city with the highest average household recreational spending a 10, we ranked the others in relation to it.
Average shelter (current consumption) costs (15%)
This number covers housing-related living expenses such as mortgage payments, rent and repairs for 2017. We divided average household income by current shelter costs, multiplying that total by two for a score out of 15.
Residents who walk or bike to work (10%)
To calculate this score, we divided the number of residents in each community who travel to work by the number who walk or bike, for a percentage out of 10.
Five-year population growth (10%)
This number covers the increase from 2012 to 2017. We show the percentage growth, with a floor of zero and a maximum score of 10.
Five-year average household income growth (25%)
This figure represents percentage income growth from 2012 through 2017. Giving the expansion a floor of zero, we scored it out of 25.
Unemployment rate (10%)
This number uses the unemployment rate from Statscan’s Labour Force Survey for September 2017. We multiplied each community’s unemployment rate by two and subtracted that amount from 20, giving a maximum score of 10.
BEST CITIES FOR WORK RANKINGS 2018
 1. Fort St. John
2017 Rank: 2
Average household income (10%): $139,305
Average household income under 35 (10%): $123,744
Average household spending on recreation (10%): $6,502
Average shelter spending (15%): $26,302
Residents who bike or walk to work (10%): 5.80%
Five-year population growth (10%): 3.43%
Five-year income growth (25%): 20.50%
Unemployment rate (10%): 5.20%
2. Dawson Creek
2017 Rank: 3
Average household income (10%): $106,440
Average household income under 35 (10%): $88,851
Average household spending on recreation (10%): $5,009
Average shelter spending (15%): $21,666
Residents who bike or walk to work (10%): 7.53%
Five-year population growth (10%): 5.17%
Five-year income growth (25%): 20.96%
Unemployment rate (10%): 5.20%
3. Squamish
2017 Rank: 1
Average household income (10%): $110,838
Average household income under 35 (10%): $92,987
Average household spending on recreation (10%): $5,837
Average shelter spending (15%): $26,572
Residents who bike or walk to work (10%): 5.37%
Five-year population growth (10%): 8.33%
Five-year income growth (25%): 18.66%
Unemployment rate (10%): 4.60%
4. Terrace
2017 Rank: 6
Average household income (10%): $94,616
Average household income under 35 (10%): $82,294
Average household spending on recreation (10%): $4,449
Average shelter spending (15%): $17,786
Residents who bike or walk to work (10%): 7.92%
Five-year population growth (10%): 0.60%
Five-year income growth (25%): 22.46%
Unemployment rate (10%): 5.60%
5. Prince Rupert
2017 Rank: 16
Average household income (10%): $96,365
Average household income under 35 (10%): $76,063
Average household spending on recreation (10%): $4,310
Average shelter spending (15%): $17,658
Residents who bike or walk to work (10%): 8.44%
Five-year population growth (10%): -5.74%
Five-year income growth (25%): 22.30%
Unemployment rate (10%): 5.60%
6. Kelowna
2017 Rank: 4
Average household income (10%): $98,260
Average household income under 35 (10%): $79,928
Average household spending on recreation (10%): $5,502
Average shelter spending (15%): $23,478
Residents who bike or walk to work (10%): 4.53%
Five-year population growth (10%): 9.96%
Five-year income growth (25%): 19.39%
Unemployment rate (10%): 7.10%
7. Victoria
2017 Rank: 16
Average household income (10%): $97,343
Average household income under 35 (10%): $74,808
Average household spending on recreation (10%): $5,511
Average shelter spending (15%): $23,414
Residents who bike or walk to work (10%): 9.31%
Five-year population growth (10%): 5.04%
Five-year income growth (25%): 16.05%
Unemployment rate (10%): 5.20%
8. North Vancouver
2017 Rank: 9
Average household income (10%): $117,507
Average household income under 35 (10%): $93,297
Average household spending on recreation (10%): $6,065
Average shelter spending (15%): $27,085
Residents who bike or walk to work (10%): 5.00%
Five-year population growth (10%): 5.97%
Five-year income growth (25%): 13.46%
Unemployment rate (10%): 4.60%
9. Vancouver
2017 Rank: 26
Average household income (10%): $95,583
Average household income under 35 (10%): $78,614
Average household spending on recreation (10%): $4,559
Average shelter spending (15%): $23,550
Residents who bike or walk to work (10%): 9.36%
Five-year population growth (10%): 6.03%
Five-year income growth (25%): 13.72%
Unemployment rate (10%): 4.60%
10. Delta
2017 Rank: 10
Average household income (10%): $117,052
Average household income under 35 (10%): $92,577
Average household spending on recreation (10%): $6,144
Average shelter spending (15%): $26,663
Residents who bike or walk to work (10%): 3.14%
Five-year population growth (10%): 5.57%
Five-year income growth (25%): 13.39%
Unemployment rate (10%): 4.60%
11. Langley
2017 Rank: 5
Average household income (10%): $108,040
Average household income under 35 (10%): $92,867
Average household spending on recreation (10%): $5,629
Average shelter spending (15%): $25,504
Residents who bike or walk to work (10%): 2.53%
Five-year population growth (10%): 7.46%
Five-year income growth (25%): 13.70%
Unemployment rate (10%): 4.60%
12. Cranbrook
2017 Rank: 17
Average household income (10%): $102,582
Average household income under 35 (10%): $77,702
Average household spending on recreation (10%): $4,590
Average shelter spending (15%): $20,987
Residents who bike or walk to work (10%): 5.84%
Five-year population growth (10%): 3.72%
Five-year income growth (25%): 21.58%
Unemployment rate (10%): 8.10%
13. Pitt Meadows
2017 Rank: 7
Average household income (10%): $103,948
Average household income under 35 (10%): $97,499
Average household spending on recreation (10%): $5,424
Average shelter spending (15%): $25,575
Residents who bike or walk to work (10%): 2.53%
Five-year population growth (10%): 7.09%
Five-year income growth (25%): 13.59%
Unemployment rate (10%): 4.60%
14. Port Coquitlam
2017 Rank: 11
Average household income (10%): $108,861
Average household income under 35 (10%): $88,017
Average household spending on recreation (10%): $5,726
Average shelter spending (15%): $26,257
Residents who bike or walk to work (10%): 2.89%
Five-year population growth (10%): 6.19%
Five-year income growth (25%): 13.71%
Unemployment rate (10%): 4.60%
15. Chilliwack
2017 Rank: 23
Average household income (10%): $84,683
Average household income under 35 (10%): $74,822
Average household spending on recreation (10%): $4,456
Average shelter spending (15%): $20,610
Residents who bike or walk to work (10%): 3.59%
Five-year population growth (10%): 8.74%
Five-year income growth (25%): 14.99%
Unemployment rate (10%): 4.60%
16. Maple Ridge
2017 Rank: 12
Average household income (10%): $102,411
Average household income under 35 (10%): $89,781
Average household spending on recreation (10%): $5,424
Average shelter spending (15%): $24,547
Residents who bike or walk to work (10%): 2.49%
Five-year population growth (10%): 6.77%
Five-year income growth (25%): 13.71%
Unemployment rate (10%): 4.60%
17. Surrey
2017 Rank: 13
Average household income (10%): $103,195
Average household income under 35 (10%): $81,026
Average household spending on recreation (10%): $5,351
Average shelter spending (15%): $25,365
Residents who bike or walk to work (10%): 2.00%
Five-year population growth (10%): 7.86%
Five-year income growth (25%): 13.67%
Unemployment rate (10%): 4.60%
18. Nanaimo
2017 Rank: 25
Average household income (10%): $85,025
Average household income under 35 (10%): $65,817
Average household spending on recreation (10%): $4,800
Average shelter spending (15%): $20,942
Residents who bike or walk to work (10%): 4.24%
Five-year population growth (10%): 6.21%
Five-year income growth (25%): 16.78%
Unemployment rate (10%): 5.20%
19. Coquitlam
2017 Rank: 14
Average household income (10%): $101,946
Average household income under 35 (10%): $80,379
Average household spending on recreation (10%): $5,126
Average shelter spending (15%): $23,966
Residents who bike or walk to work (10%): 2.56%
Five-year population growth (10%): 6.93%
Five-year income growth (25%): 13.74%
Unemployment rate (10%): 4.60%
20. Abbotsford/Mission
2017 Rank: 19
Average household income (10%): $93,522
Average household income under 35 (10%): $77,121
Average household spending on recreation (10%): $4,923
Average shelter spending (15%): $23,054
Residents who bike or walk to work (10%): 2.06%
Five-year population growth (10%): 7.90%
Five-year income growth (25%): 14.70%
Unemployment rate (10%): 4.60%
21. Vernon
2017 Rank: 22
Average household income (10%): $92,153
Average household income under 35 (10%): $75,822
Average household spending on recreation (10%): $5,129
Average shelter spending (15%): $22,314
Residents who bike or walk to work (10%): 3.93%
Five-year population growth (10%): 5.15%
Five-year income growth (25%): 19.41%
Unemployment rate (10%): 7.10%
22. Courtenay
2017 Rank: 21
Average household income (10%): $86,328
Average household income under 35 (10%): $74,901
Average household spending on recreation (10%): $4,790
Average shelter spending (15%): $20,322
Residents who bike or walk to work (10%): 4.26%
Five-year population growth (10%): 3.80%
Five-year income growth (25%): 17.36%
Unemployment rate (10%): 5.20%
23. Parksville
2017 Rank: 29
Average household income (10%): $80,782
Average household income under 35 (10%): $65,075
Average household spending on recreation (10%): $4,487
Average shelter spending (15%): $18,726
Residents who bike or walk to work (10%): 4.55%
Five-year population growth (10%): 5.70%
Five-year income growth (25%): 16.05%
Unemployment rate (10%): 5.20%
24. Campbell River
2017 Rank: 24
Average household income (10%): $89,423
Average household income under 35 (10%): $74,809
Average household spending on recreation (10%): $5,054
Average shelter spending (15%): $21,541
Residents who bike or walk to work (10%): 3.28%
Five-year population growth (10%): 3.99%
Five-year income growth (25%): 17.06%
Unemployment rate (10%): 5.20%
25. Richmond
2017 Rank: 20
Average household income (10%): $94,408
Average household income under 35 (10%): $75,268
Average household spending on recreation (10%): $4,684
Average shelter spending (15%): $22,802
Residents who bike or walk to work (10%): 2.57%
Five-year population growth (10%): 6.95