Some companies in our ranking had a much betteror worse2016 than others. Here are 10 that stood out
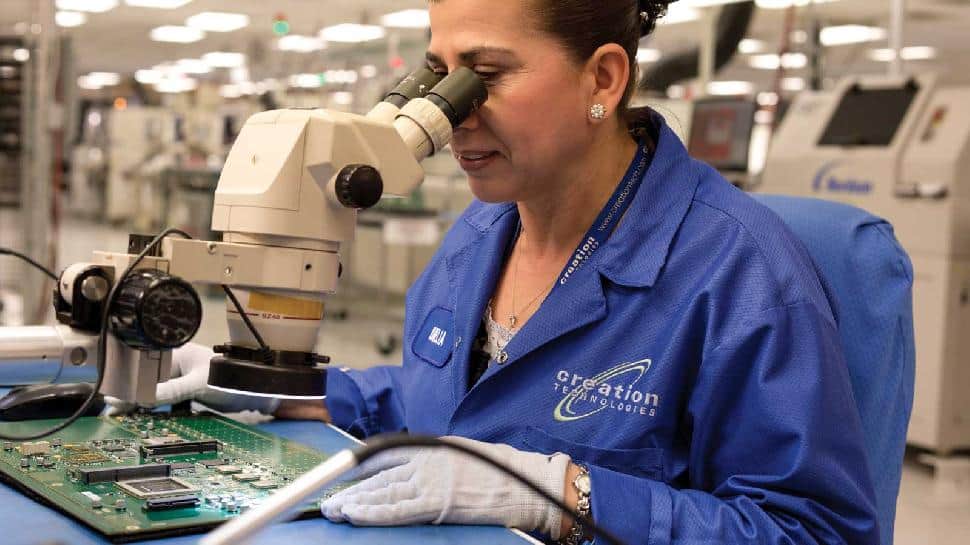
PARTS ADD UP
It was a good year for technology component maker Creation Technologies

Creation Technologies
Revenue change: 47.3%
Net income: NA
Net income change: NA
Burnaby-based Creation Technologies has enjoyed a prolonged phase of rapid growth. The company, which has 3,000 employees and 13 manufacturing plants in Canada, the U.S., Mexico and China, designs and builds high-tech components for clients that sell them under their own brands to third parties. With 10 of its plants in North America, Creation has access to aerospace and defence customers that most rivals can’t top. Clients outsource high-end components—everything from power systems for airport X-ray machines to circuit boards for CT scanners—to Creation, which oversees design, prototyping, testing, order fulfillment and repairs. Business is booming. The privately held company’s revenue topped $800 million in 2016, and Creation has more than doubled its sales force in the past 18 months.
Hardwoods Distribution Inc.
Revenue change: 38.1%
Net income: $23.5 million
Net income change: 35.6%
First, a primer on the difference between hardwood and softwood, because it’s not what you might expect. Softwood comes from conifers and is popular in construction—think two-by-fours—because of its malleability. It also accounts for the vast majority of lumber milled and processed in B.C. Hardwood comes from deciduous trees and is much less construction-friendly—more suitable for floorboards, cabinetry and decoration. Little of it is milled in Canada. That’s where Langley-headquartered Hardwoods Distribution comes in. One of the largest distributors of hardwood in North America, the company sold some $789 million worth of lumber in 2016, up from almost $572 million in 2015. It owes most of that rise to its US$107-million takeover of Rugby Acquisition LLC, a leading U.S. wholesaler. Although Hardwoods Distribution is based in B.C., the bulk of its business comes from selling lumber harvested in the eastern U.S. back into the American market, which accounts for 85 per cent of its revenue.
Wheaton Precious Metals Corp.
Revenue change: 42.4%
Net income: $352.58 million
Net income change: 31.1%
Despite volatile precious metals prices, Wheaton Precious Metals—formerly known as Silver Wheaton—made bank from gold in 2016. The Vancouver-based company, which has stakes in 22 operating mines in 10 countries, benefited from a spike in gold production at the Salobo mine in northeast Brazil and Constancia mine in Peru. In total, its streams produced 353,700 ounces of gold in 2016, up 110,700 from 243,000 ounces in 2015. Gold became such an important component of revenue last year that the company dropped “Silver” from its name this May. Wheaton also has a unique business model among major miners. It doesn’t own any mines outright; instead, it buys a share of production upfront. In the case of Salobo, which is operated by Brazil’s Vale SA, Wheaton Precious Metals paid US$3.06 billion for 75 per cent of future production in 2013. It’s a lucrative strategy in years when precious metals prices rise, and 2016 was one of them.
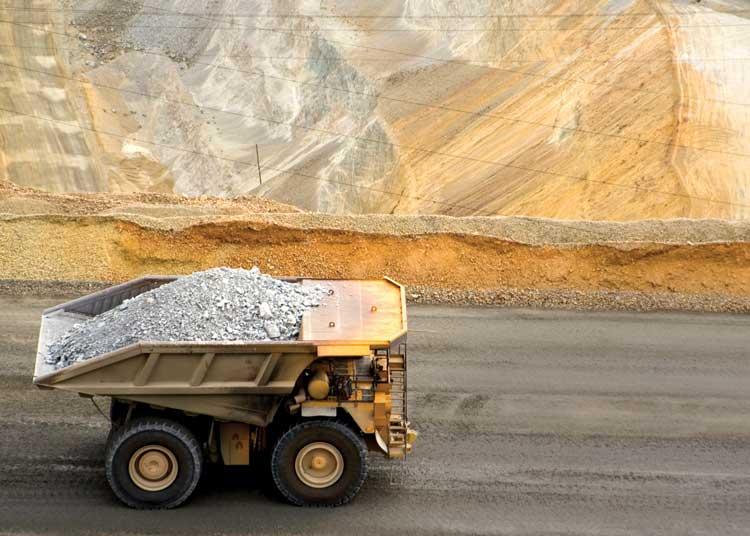
MINING PROFITS
Wheaton Precious Metals and Imperial Metals both made good hauls in 2016
Imperial Metals Corp.
Revenue change: 232.7%
Net income: $55 million
Net income change: NA
In the days following the collapse of a tailings pond dam at the Mount Polley mine near Williams Lake in August 2014, Vancouver-based Imperial Metals was forced to halt operations at its most important asset. That stoppage sent production of copper and gold into a tailspin, with the former falling from 24.5 million pounds in 2014 to eight million pounds in 2015. By the end of that year, the company had posted a $97-million net loss. Luckily for Imperial, Mount Polley wasn’t its only asset in the works. Less than a year after the spill, the company started production at the Red Chris Mine, its new gold and copper concern in far northwestern B.C. Thanks to a steady increase in output at that mine—it generated $293.3 million in revenue in 2016—and the full reopening of Mount Polley in June 2016, Imperial’s production of copper increased from 58.5 to 83.6 million pounds between 2015 and last year. Its gold output almost doubled, from 25,949 ounces to 47,088.
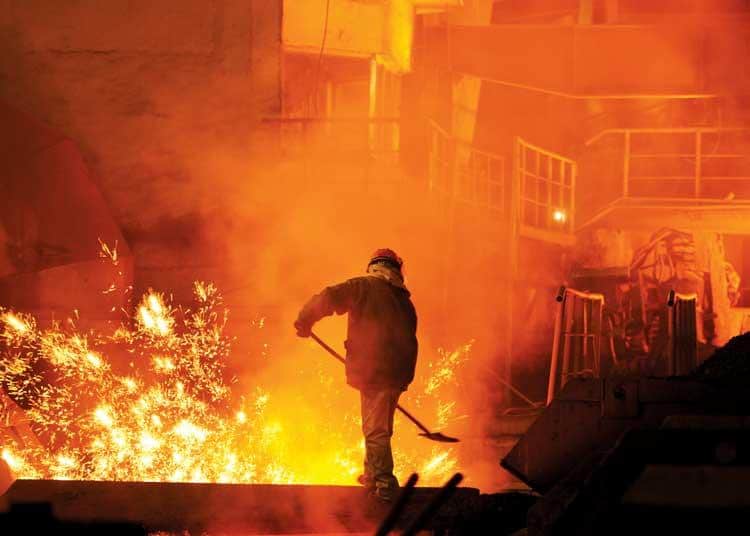
HOT COMMODITY
B.C. mining companies have benefited from the high price of steelmaking coal
Teck Resources Ltd.
Revenue change: 12.6%
Net income: $1.04 billion
Net income change: NA
Teck Resources is the world’s second-largest seaborne exporter of steelmaking coal, so the Vancouver mining company’s bottom line is directly linked to China, its biggest market. In 2016, after a multiyear downward trend in steelmaking coal prices, demand took a sharp turn upward. Although Teck owns a mix of 13 coal, zinc, copper and oilsands operations in North and South America, its revenue gains last year came entirely from its coal business. Prices that started at a low of US$74 a tonne in February 2016 reached US$300 by November. That surge came as the company boosted production from 25.3 million to 27.6 million tonnes. The result: record sales, with coal revenue from Teck’s Kootenay mines $1.1 billion higher in 2016 than the year before.
 Westshore Terminals Investment Corp.
Revenue change: 11.3%
Net income: $135 million
Net income change: 4.7%
A lump of steelmaking coal and a lump of thermal coal may look alike, but as commodities they behave in remarkably different ways. For Westshore Terminals Investment Corp., owner of the largest coal loading facility on the west coast of North America, those differences matter. Thanks in part to slackening demand from Japanese and South Korean power utilities, Westshore’s thermal coal shipments fell from 9.1 million to 6.3 million tonnes between 2015 and last year. And there’s another threat on the horizon: Christy Clark’s electoral promise to ban the transshipment of U.S. thermal coal through B.C. would have a big impact on Westshore if it became policy. The other side of Westshore’s business, steelmaking coal, has remained more lucrative and less controversial. The company shipped 25.8 million tonnes of it in 2016, down 10 per cent from 28.8 million the year before, partly due to construction at its Delta facility, which has temporarily reduced export capacity. Once the terminal expansion wraps up in 2019, Westshore will be able to ship three million more tonnes a year.
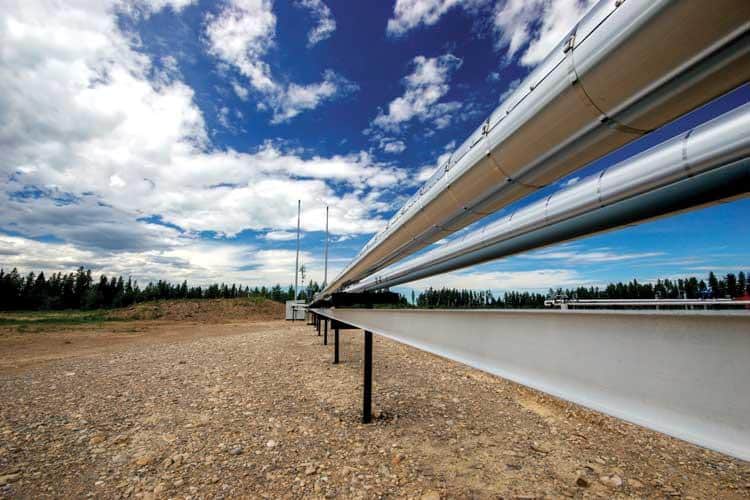
Westcoast Energy Inc.
Revenue change: 10.3%
Net income: $268 million
Net income change: 6.9%
With a network of natural gas pipelines crisscrossing B.C. and Alberta, Westcoast Energy specializes in transporting gas from well to market. Last year the company sold one of its businesses, consisting of seven terminals and a gas pipeline, for $267 million. That transaction, combined with lower natural gas prices and demand overall, led to a $364-million decline in revenue. Altogether the sale of Empress NGL, which generates propane, butane and ethane (all byproducts of natural gas), accounted for 38 per cent of the drop in revenue. Last September, Westcoast’s owner, Houston-based Spectra Energy Corp., announced a US$28-billion merger with Calgary-headquartered Enbridge Inc. The deal’s completion in February leaves Enbridge the owner of a network of gas storage, transmission and distribution facilities that connect the gas fields of northwestern B.C. with the North American grid.
Best Buy Canada Ltd.
Revenue change: 38.2% (estimate)
Net income: NA
Net income change: NA
One evening in March 2015, U.S. retailer Best Buy Co. Inc. permanently shuttered 66 of its Future Shopbranded stores in Canada with little notice or fanfare. The company temporarily closed another 65 locations to rebrand them as Best Buy outlets. It was an abrupt end to B.C.grown Future Shop and an effort to save the retailer’s Burnaby-based Canadian division. With fewer stores, sales dropped substantially in 2016. International revenue fell by 26.2 per cent from 2015 to 2016 (84 per cent of Best Buy’s floor space outside the U.S. is in Canada) as the company also faced a hike in the costs of lease exits, employee termination benefits and inventory writedowns. In early 2015, Best Buy had 209 full-service stores across Canada. By the end of last year, it was operating 136. There are silver linings: costs fell significantly as the company reduced head count and store operating costs, while also consolidating its marketing under one brand. In another glimmer of hope, the Canadian division saw revenue growth in appliance sales.

WHAT’S THE DEAL?
Investment bank Canaccord Genuity saw revenue fall with energy and commodity prices
Canaccord Genuity Group Inc.
Revenue change: 10.6%
Net income: $358.6 million
Net income change: NA
When companies do deals, investment banks benefit. In 2016, in Canada at least, the deals dried up. For Vancouver-based Canaccord Genuity Group, which offers investment banking and advisory services for corporations and wealth management for private clients, the fallout wasn’t pretty. Canaccord Genuity’s Canadian division saw revenue drop by 36 per cent, from $204.6 million in 2015 to $131.4 million, as slumping energy and commodity prices weighed down the Canadian economy. Overall, revenue from Canaccord Genuity’s investment banking division plunged 44 per cent, from $238.5 million to $134.2 million. However, diversification yielded benefits in 2016, when offices in the U.S., Europe, Asia and Australia partly made up for losses in the U.K. and Canada.
Powerex Corp.
Revenue change: 34.6%
Net income: $61 million
Net income change: 48.7%
Tasked with selling B.C.-generated electricity to Alberta and the Western United States, Powerex is BC Hydro and Power Authority’s window on the world. A wholly owned subsidiary of BC Hydro, Powerex markets and brokers sales of natural gas for the utility and private sector exporters, generating healthy revenue for its parent in good years. The formula is simple: buy hydro-generated and natural gas low and sell high in markets like California. That is, until one side of the formula starts to break down. Last year sagging demand from the U.S. led to a fall in sales. Powerex’s trade revenue dipped by almost 35 per cent between 2015 and 2016, from $919 million to $601 million, owing to low natural gas prices and a 33 per cent slide in the volume of electricity sold. The drivers of that shrinking appetite? A mix of warm weather in the first half of last year and a boost in U.S. natural gas production. Meanwhile, an outage of a key transmission line between Canada and California contributed to the drop in power sales to one of Powerex’s biggest markets.
BIGGEST REVENUE GAINERS [BY PERCENTAGE]
1. Imperial Metals Corp.
REVENUE 2016 ($000): 428,218
REVENUE 2015 ($000): 128,701
% CHANGE: 232.7
2. Imperial Parking Corp.
REVENUE 2016 ($000) : 723,222
REVENUE 2015 ($000): 407,000
% CHANGE: 77.7
3. Creation Technologies
REVENUE 2016 ($000): 834,628 c
REVENUE 2015 ($000): 566,469 c
% CHANGE: 47.3
4. Wheaton Precious Metals Corp.
REVENUE 2016 ($000): 1,181,140 c
REVENUE 2015 ($000): 829,483 c
% CHANGE: 42.4
5. Seaspan ULC
REVENUE 2016 ($000): 766,000
REVENUE 2015 ($000): 543,000
% CHANGE: 41.1
6. Hardwoods Distribution Inc.
REVENUE 2016 ($000): 789,321
REVENUE 2015 ($000): 571,598
% CHANGE: 38.1
7. Silver Standard Resources Inc.
REVENUE 2016 ($000): 650,461
REVENUE 2015 ($000): 479,928 c
% CHANGE: 35.5
8. South Coast B.C. Trans. Auth. (TransLink)
REVENUE 2016 ($000): 2,152,346
REVENUE 2015 ($000): 1,627,650
% CHANGE: 32.2
9. First Majestic Silver Corp.
REVENUE 2016 ($000): 368,398 c
REVENUE 2015 ($000): 280,605 c
% CHANGE: 31.3
10. Capstone Mining Corp.
REVENUE 2016 ($000): 701,355 c
REVENUE 2015 ($000): 537,640 c
% CHANGE: 30.5
c=converted from USD at 1.3248 (2016) and 1.2787 (2015) Revenue is by fiscal year
BIGGEST REVENUE LOSERS [BY PERCENTAGE]
1. Eldorado Gold Corp.
REVENUE 2016 ($000): 573,279 c
REVENUE 2015 ($000): 1,103,901 c
% CHANGE: 48.1
2. Best Buy Canada Ltd.
REVENUE 2016 ($000) : 2,500,000 e
REVENUE 2015 ($000): 4,047,000 e
% CHANGE: 38.2
3. Powerex Corp.
REVENUE 2016 ($000): 601,000
REVENUE 2015 ($000): 919,000
% CHANGE: 34.6
4. Turquoise Hill Resources Ltd.
REVENUE 2016 ($000): 1,594,116 c
REVENUE 2015 ($000): 2,090,388 c
% CHANGE: 23.7
5. Goldcorp Inc.
REVENUE 2016 ($000): 4,650,070 c
REVENUE 2015 ($000): 5,594,360 c
% CHANGE: 16.9
6. CHC Helicopter Corp.
REVENUE 2016 ($000): 1,831,532 c
REVENUE 2015 ($000): 2,183,654 c
% CHANGE: 16.1
7. Westshore Terminals Investment Corp.
REVENUE 2016 ($000): 324,463
REVENUE 2015 ($000): 365,817
% CHANGE: 11.3
8. FortisBC Energy Inc.
REVENUE 2016 ($000): 1,151,000
REVENUE 2015 ($000): 1,294,000
% CHANGE: 11.1
9. Canaccord Genuity Group Inc.
REVENUE 2016 ($000): 787,805
REVENUE 2015 ($000): 880,763
% CHANGE: 10.6
10. Westcoast Energy Inc.
REVENUE 2016 ($000): 3,167,000
REVENUE 2015 ($000): 3,531,000
% CHANGE: 10.3
e=estimate; c=converted from USD at 1.3248 (2016) and 1.2787 (2015) Revenue is by fiscal year