Continuing with a post-pandemic theme of resiliency, our ninth annual ranking of B.C.’s best cities for work sees the return of a top pre-COVID contender and shines a spotlight on the economic dynamism of B.C.’s small cities. As the province emerges from the pandemic, our assessment of its 50 largest communities reveals how local businesses and top performers from three regions are adjusting to the new state of normal.
When Christine Coletta and husband Steve Lornie bought their first recreational property in Summerland in 1999, they were preparing to spend their retirement years enjoying an idyllic, smalltown retreat in the sun-drenched Okanagan Valley. But after planting their first vineyard in 2006 and launching Okanagan Crush Pad Winery in 2011, their so-called retirement has been anything but leisurely. “Yeah, that plan didn’t go too far—maybe in five years’ time,” admits Coletta.
After 12 years in operation, Okanagan Crush Pad—which provides shared production space and equipment to smallscale grape growers looking to start their own wineries—is busy preparing to launch a number of adventurous new initiatives. In addition to producing their own internationally recognized wines under a growing list of labels—Haywire and Narrative among them—Coletta and Lornie are adding new facilities and operations, both at the Crush Pad site and at their nearby Garnet Valley Ranch property.
As B.C. transitions out of the pandemic, Coletta and Lornie are just two of the province’s many entrepreneurs trying to find their way back to business as usual while facing new hurdles along the way. “The challenge for all of us living in small, rural towns is labour attracting people, retaining them and accommodating them with housing,” Coletta says. While promising economic opportunities abound, Coletta’s experience reflects the same challenges that most B.C. communities will be grappling with in the year ahead.
Carrying forward last year’s metrics and with help from research partner Environics Analytics, our editorial team used 10 indicators to evaluate a range of economic factors for our 2023 survey of B.C. cities—including growth, employment and housing, as well as aspects of social and environmental resiliency (for details, see page 40).
To provide additional insight into how local economies and businesses are navigating a post-pandemic world, we’re taking a closer look at three of this year’s top regional performers and checking in with local business leaders representing diverse industries including outdoor recreation, food services and agritourism—about their perspectives on the year ahead.
B.C.’s Most Resilient Cities in 2023
Nos. 1 to 17

Nos. 18 to 34

Nos. 35 to 50

Back to Business as Usual
Our annual ranking has shown time and time again that when it comes to the economic fortunes of our communities, change is one of the few certainties. In that regard, our third assessment of B.C.’s most resilient cities does not disappoint, underscored by Squamish’s meteoric rise of 31 spots back into the No. 1 position after a two-year absence.
Embodying last year’s conferred “resilient” status, six cities have managed to maintain their positions in this year’s top 10: the City of North Vancouver (No. 2), Parksville (No. 3), Coquitlam (No. 6), Kelowna (No. 7), Langford (No. 8) and Central Saanich (No. 9). Joining fellow returnee Squamish (No. 1) are Sidney (No. 4) and Sechelt (No. 5) with newcomer Summerland (No. 10) rounding out the frontrunners.
Rising a collective 43 and 25 places, respectively, this year’s biggest regional gainers were the Sea-to-Sky Corridor, comprising Squamish and Whistler (No. 11), and the Fraser Valley, which includes Chilliwack (No. 12), Mission (No. 19) and Abbotsford (No. 32).
Despite representing two of this year’s top 10 cities, Metro Vancouver communities slid a collective 83 spots from last year’s ranking, with the District of North Vancouver (No. 36), Vancouver (No. 33), Richmond (No. 38) and New Westminster (No. 16) taking the greatest tumbles. An eroding rental vacancy rate, slowing housing starts and weaker—though still positive—job growth were all contributing factors. Port Coquitlam (No. 28) was the only Metro Vancouver community to see a double-digit jump in this year’s list, aided by a rare improvement in rental vacancy rates over the year prior.
Vancouver Island put forth another strong showing, with its communities once again representing half of this year’s top 10. However, this belies the region’s somewhat more tumultuous results, which saw Sidney and Campbell River (No. 27) jump 15 and 11 spots, respectively, while Comox (No. 14), Courtenay (No. 24) and Saanich (No. 31) all saw double-digit drops. Nevertheless, overall healthy population growth, secure household finances, solid residential sales and development and the tightest unemployment rates in the province continue to make the region a top contender.
The performance of B.C.’s Interior and Northern communities were relatively stable, with most seeing only minor shuffling in this year’s ranking. Continuing trends from years prior, the Thompson-Okanagan had healthy representation in the top half of this year’s list, with only Kamloops (No. 39) seeing a double-digit change as low housing starts drove a drop of 11 spots.

The Comeback Kid
Squamish—one of the province’s fastest-growing communities over the last decade—is no stranger at the top of our annual list. In fact, this is its fourth time in the No. 1 position in the nine-year history of our ranking. After spending an unprecedented two-year stint in the lower half of the pack, Squamish has made a commanding comeback, propelled by high growth, healthy housing sales, an active construction industry, strong job creation and a low unemployment rate.
According to Squamish Mayor Armand Hurford, there’s a key factor behind the community’s success that our ranking doesn’t quite capture: “One of the things that does set Squamish apart is our access to the outdoors and the lifestyle here—it’s a very desirable place to live, work and play.”
As affordability challenges in nearby Metro Vancouver spur residents to look further afield for housing opportunities, Squamish has been capitalizing on its relatively lower costs by leveraging those offerings to attract new residents—as well as like-minded entrepreneurs. “Business owners have developed their business around this lifestyle,” says Hurford. “We’ve seen success with firms in performance apparel gear, equipment design and manufacturing and adventure-based media marketing.”
One of the businesses lured by Squamish’s nature-affirming lifestyle is OneUp Components, which designs, engineers and sells high-performance mountain bike parts. “We’re passionate about the outdoors and wanted to remove obstacles that prevented us from enjoying them,” says OneUp co-owner and CFO Chris Heynen. Easy access to the Sea-to-Sky Corridor’s trail networks was a bonus for the company’s product testing and development needs.
OneUp is part of a burgeoning local recreation tech industry and, since setting up shop in Squamish in 2013, the brand has established a global reach. Citing the 2014 move of Pinkbike—a leading provider of digital mountain bike media and entertainment—to the mountain city, along with the organic growth of several hometown bike brands and interest from other outside companies looking to set up a local presence, Heynen thinks Squamish is making a mark. “The industry has firmly become established in this town,” he says. “[Squamish] has become a destination for the sport.”
But despite these recent successes and its continued rapid growth, Squamish hasn’t been immune to COVID-19.
“There were definitely businesses that were heavily impacted and didn’t make it,” says Hurford. But, adds the mayor, the community was still able to find creative ways to support employers, such as a grant-writing program that secured more than $600,000 for over 60 businesses.
Hurford also points to the pandemic’s uneven impact on the community. As the world went into lockdown in early 2020, he says, people began flocking to outdoor recreational activities as a way to cope with COVID-induced cabin fever—much to the benefit of outdoor recreation businesses. But that unprecedented demand created its own unique challenges—ones that continue to affect the industry today.
“The long lead times and increased demand created a surge of inventory that has now been delivered just when the market has taken a [downward] shift,” says OneUp’s Heynen. That oversupply of product is lock- ing up capital and leaving local businesses struggling to find warehouse space in which to store it all.
While the labour shortage has been another ongoing issue for many industries and communities in the wake of the pandemic, it hasn’t been a particular challenge for OneUp. “Squamish is not a hard sell,” Heynen says, noting that an explosive expansion of the region’s trail network has shaped the city into a high-calibre riding destination for the larger biking community. “It has also convinced many other bike companies to establish a presence here, which helps to foster and attract talent,” he explains. “Almost all of our employees have come directly from this community.”
But a problem that Squamish did not completely escape is the decline in housing affordability that is being felt across the province. “There is still quite a large talent pool around Vancouver and Whistler to draw from and Squamish remains competitive to those areas with regards to housing,” says Heynan. “However, the advantage is being eroded quickly.”
Mayor Hurford cites a number of ongoing strategies the community is working on to help address the growing affordability challenges. These include an effort from local businesses to offer more flexible hours to help their employees juggle childcare needs, as well as the formation of the new Squamish Community Housing Society, which is tasked with increasing access to affordable housing for a broad demographic.
Such planning takes a deft hand, however: as decision-makers in Squamish and other B.C. communities work to increase their housing supplies, notes Hurford, an important consideration is that the new builds do not come at the cost of land designated for employment or the amenities that are critical to keeping jobs and economies afloat. “We need to make sure that we keep that economic development lens solidly in place while we look at these land use decisions so that we don’t erode our ability to be a thriving place to do business,” he says.
Heynen agrees: “It’s a very tricky balance to get correct,” he says. While the business owner acknowledges the need for Squamish’s housing to remain affordable, his greatest concern is seeing new development expand the edges of the community at the expense of its natural areas. “If the mountain bike trail network was developed into housing [and] access became harder and harder to achieve, it would push some players out of the area,” Heynen concedes. “Companies will move elsewhere.”

Knocking it Out of the Park
Parksville, a coastal resort town north of Nanaimo that’s popular with tourists and retirees, is the top performing city on Vancouver Island. Healthy household finances, strong residential sales, low unemployment and solid performance on many other indicators has kept it within our ranking’s top 10 communities for three years running.
“Tourism is one of our most significant employers, although the construction industry is certainly equal to that,” explains Kim Burden, executive director of the Parksville and District Chamber of Commerce.
But as the community continues to grow, it is seeking to further diversify its economy, Burden says. Recent initiatives include the launch of a tech attraction strategy, and the establishment of a micro-fulfillment centre—known as DELVI, or Deliver Vancouver Island—that is similar in function to Amazon in that it offers warehousing and delivery, but with a focus on serving local businesses. “We’ve probably got about a dozen tenants that we’re providing service to—everything from fertilizer to furniture,” he explains, noting that the initiative is still in its early stages.
Burden also points to the growth of local food and beverage services such as craft breweries and distilleries as another bright spot in the community. That industry showed respectable resiliency even through the pandemic, he says: “We gained a couple of restaurants, which is surprising considering they were one of the hardest hit sectors of the economy.”
One of Parksville’s newest eateries is Happy Jack’s Restaurant, owned and operated by Jordan and Sherri Porth. The couple moved with their business to Parksville from Houston, B.C., after becoming infatuated with the city during a trip to the coast in 2021. “We found the people incredibly friendly with a laid-back approach, and knew that this was a place for our brand and a place we could call home,” recalls Jordan.
In the face of lingering pandemic uncertainty, the need to rehabilitate a long-vacant and water-damaged building and an unexpected incident with a runaway truck, the Porths were able to open the doors of Happy Jack’s in July 2022. “People have been very supportive since day one, and that has continued on as word has spread of what we have to offer,” Jordan says.
While the restaurant has not experienced any serious COVID outbreaks since its opening, Happy Jack’s continues to be plagued by some of the pandemic’s knock-on effects. “One of the biggest changes has been the rapid increase of costs,” says Jordan, blaming inflation, COVID-induced supply chain issues and mandated increases to the minimum wage for a narrowing in the industry’s already razor-thin margins.
Labour shortages have been another ongoing problem. “Hiring is certainly a challenge for our industry, no matter what city you are in,” Jordan confirms. Happy Jack’s was fortunate to have been able to hire on enough staff to add lunch service to its schedule just a few months after opening. Now, the Porths are keen to add more. “We currently have around 25 staff members and are always looking for the next great person to join our team,” says Jordan.
According to Kim Burden, ranking among the oldest communities in Canada does not help with Parksville’s labour woes. He hopes that attracting more young working families to the area will help to balance the large share of retirees in the city who still consume services but are no longer in the workforce. “If the seniors in our community want to enjoy a continuation of the services that they need, then those young people have to come work in those areas,” he says.
To that end, Parksville is working to ensure that it can provide the kinds of amenities that attract and retain families. But, says Burden, the city also needs to raise the profile of what it already has to offer. One of the ways the chamber is trying to accomplish this is through a new website that touts the economic and lifestyle advantages of the area with an eye to luring business, investment and working-age residents. “We want to be able to get the word out a little broader, to bring people here with their entrepreneurial skills and ideas,” Burden explains.
Jordan Porth of Happy Jack’s is optimistic about Parksville’s economic trajectory, and says the community has much to offer any prospective residents or entrepreneurs. “The city has a desire to attract families, has new developments going up all over, vast new neighbourhoods, a new pool complex on the horizon and a climate and location that is second to none,” he says. “We have personally lived in the Lower Mainland, the Okanagan [and] Northern B.C., and no place comes close to living here.”

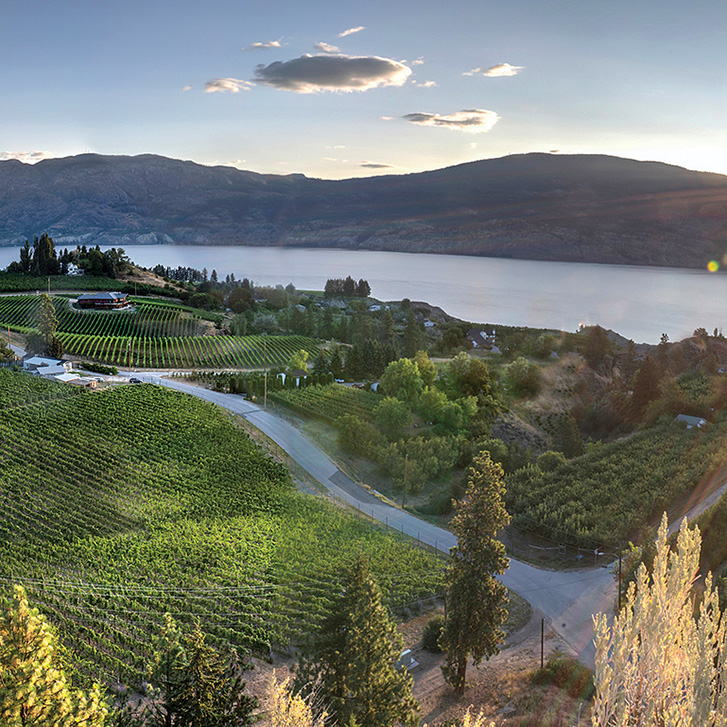
Always Sunny in Summerland
Summerland—ranking in the top 10 for the first time since being added to our annual list in 2019—has become one of the top performers in the B.C. Interior, and is a prime example of the dynamism, creativity and economic vibrancy shown by B.C.’s smaller cities. Stable household finances, robust residential sales, solid job growth, low unemployment and a better-than-most (albeit barely satisfactory) rental vacancy rate all helped buoy the community’s score.
“We certainly are small in scale, so we can get a little lost amongst our neighbours, being smushed between Penticton and Kelowna,” admits Kristin Parsons, interim executive director and business advisor at the Summerland Chamber of Commerce. But Parsons believes the community is at a turning point: “The next five years are going to see Summerland come out on its own and no longer be the little sister.”
In recent years, Summerland has repositioned its economic focus to turn a major constraint into an economic opportunity. Recognizing that 80 percent of its land is within the province’s restrictive Agricultural Land Reserve, or ALR, the community has decided to lean into those agrarian roots. “Agritourism opportunities and accommodations development is a huge opportunity for our community to differentiate ourselves,” Parsons explains.
Taking advantage of that opportunity has included encouragement for local agricultural businesses to add tours, onsite accommodations and hands-on experiences to their operations, and to provide visitors with a chance to sample local products straight from the farm. O’Kana Guest Ranch, which offers yurt-based “glamping,” is just one example of this new breed of tourism enterprise that Parsons points to—adding that such unique accommodations also offer visitors a home base from which to access more experiences in the region.
Okanagan Crush Pad is among the Summerland businesses that are fully embracing agritourism ambition. Coletta and Lornie are in the process of opening a dedicated tourism centre on the property, as well as introducing overnight tourist accommodations and a tasting room at Garnet Valley Ranch. “We’ve put some campsites in spots and we have an Airstream that we’ll be able to offer to people,” Coletta notes.
As owners of a longstanding wine tourism destination, the pair is hopeful about the industry’s future in the area after a few rocky years of navigating through the pandemic. “It was fraught with anxiety for the last couple of years as people were either very, very sensitive or a little brazen in terms of public health—we had all sorts of people and had to balance out the needs and attitudes of many,” says Coletta.
But, she adds, Summerland’s caring residents have helped carry local businesses— and each other—through the tough times. “The level of generosity and politeness that prevails in Summerland really shined through,” Coletta explains. “People were sharing, and giving elderly people their place in line to get them through lengthy checkouts, and just all of the social kindness that small towns are famous for.”
While a rebound in tourism is a safe long-term bet following the lows of the pandemic, housing and labour remain areas of concern in Summerland—repeating an all-too-common refrain that is being heard across the province.
According to Parsons, the two issues are directly linked, and both are becoming a particularly acute issue in smaller communities like Summerland, where COVID-induced demand and an already limited housing stock have led to rapidly rising costs and few options for prospective tive residents and employees. “We have a lot of employees that are going to bigger communities where there’s more housing stock availability and lower rent,” Parsons says. She further notes that it’s easier for people to find housing in nearby Penticton, where they also tend to make more money and can commute a shorter distance, providing additional savings on gas costs.
Given that most of the Summerland area is protected from development within the ALR, the municipality is facing a much more daunting undertaking to build its way out of this housing supply crisis. Crush Pad’s Coletta says there have been some recent moves to help address the issue, such as the Agricultural Land Commission allowing secondary residences within the ALR, and the District of Summerland supporting more legal suites in existing and new houses. These changes are much welcomed, notes Coletta, but she asserts that there is still far more that needs to be done: “I think all of that is positive, but it’s just a fraction of what we really need.”
On a brighter note, local business leaders in Summerland remain undeterred by the community’s current trials. “I think our time in the spotlight is about to come,” affirms Coletta. “I would say, keep Summerland on your radar over the next few years,” echoes an equally optimistic Parsons. The recent completion of new strategic plans for tourism, a downtown revitalization and development at the waterfront are all signs of community partners coming together in support of an ambitious long-term vision for their town.
How We Crunched the Numbers
To determine the most economically resilient cities in B.C., we examined 10 indicators with weightings ranging from 5 to 15 percent. Unchanged from last year, the indicators consider economic resiliency more broadly than in years past following in the wake of the COVID-19 pandemic, including aspects of social and environmental resiliency. Each city received a score out of 100 points and is ranked accordingly.
Five-year population growth (maximum score of 10 points)
This figure represents the population growth for each city from 2017 to 2022. We gave the highest-growth city 10 points and scored the others in proportion to that.
Household financial vulnerability (15 points)
This figure—an index created by Environics Analytics—looks at a range of household financial variables, including debt, liquid assets and discretionary income, to show how precarious a typical household’s finances are in a given city. The higher the index value, the more vulnerable a city’s households are on average. Therefore, we gave the lowest value 15 points and scored the others in relation to that.
Resident sense of belonging (5 points)
This value represents the sense of belonging that a resident has within their community, as derived from Environics Analytics’ Community Life Survey. Cities that had a greater share of residents reporting a “very strong” or “somewhat strong” sense of belonging scored higher than those with more residents reporting a “somewhat weak” or “very weak” sense of belonging. We assumed that cities with a stronger sense of community had stronger social resiliency. The city with the highest sense of belonging received a score of 5, with the others scoring in proportion.
Residential greenhouse gas (GHG) emissions per 10,000 residents (5 points)
This number reveals the amount of residential GHG emissions produced by a city annually per 10,000 residents, measured in tons of CO2. Derived from B.C.’s Provincial GHG Emissions Inventory, this value reflects residential energy use, including emissions estimates from electricity, natural gas, wood, oil, and propane consumption. Given the economic risk and uncertainty posed by climate change, as well as rising energy prices spurred by recent geopolitical turmoil, we assumed a positive correlation between a city’s environmental and economic resilience. As cities that use less energy and/or cleaner sources see fewer emissions on average, the city with the lowest value received 5 points, with the others scoring accordingly.
Rental vacancy rate (10 points)
This indicator reflects the reported vacancy rate for rental housing units from Canada Mortgage and Housing Corp.’s annual Rental Market Survey. Housing market observers, such as the Royal Bank of Canada, consider a healthy rental vacancy rate to be between 3% and 5%. Therefore, a vacancy rate of 4% received the maximum score of 10, with cities above or below that value scoring proportionately less.
Residential sales per 10,000 residents (10 points)
This number, from quarterly BC Assessment data, reflects the year- to-date sales totals for single-family and strata residential properties to the end of September 2022. After dividing sales totals by total city population, we multiplied that figure by 10,000 to determine the number of sales per 10,000 residents. We gave the highest value 10 points and scored the others accordingly.
Housing starts per 10,000 residents (10 points)
We derived this value from the year-to-date housing starts from Canada Mortgage and Housing Corp.’s monthly Starts and Completions Survey to the end of September 2022. The city with the highest number of housing starts per 10,000 residents received a score of 10, with the other cities scoring in relation to that.
Change in jobs per 10,000 residents (10 points)
This figure measures the change in the employed labour force from January to September 2022, derived from StatsCan’s monthly Labour Force Survey. We scored the year-to-date difference in jobs out of a maximum value of 10.
Average annual unemployment rate (10 points)
For this indicator, we averaged unemployment rates for each city from the first three quarters of the year. The averages were derived from rates reported in StatsCan’s monthly Labour Force Survey for January through September 2022. We gave the lowest average 10 points and evaluated the others in relation to that.
Economic diversity (15 points)
This value is derived by applying the Herfindahl–Hirschman Index—a common means of measuring diversity—to StatsCan employment data to determine the labour force diversity of a city’s residents. The closer this number is to 10,000 the less diverse a city’s workforce is while a number closer to 0 represents a more diverse workforce. Therefore, we gave the lowest value 15 points and scored the others in relation to that.
Just So You Know
- Our ranking only includes cities of 10,000 or more permanent residents.
- We excluded bedroom communities such as Lake Country, Oak Bay and West Vancouver, which may offer a high quality of life but have relatively small job markets.
- Langley and North Vancouver are represented on the ranking by both their city and district municipalities.
- Although we use the term “city” throughout, our annual survey is technically a ranking of municipalities, as legally defined by the B.C. Local Government Act.
- We work with research partner Environics Analytics because we believe it has the best data available—but even the best data has its limitations. To produce municipal level population growth numbers, for example, Environics Analytics used regional level estimates from Statistics Canada to make 2022 projections.
- Job numbers and unemployment rates come from StatCan’s monthly Labour Force Survey and only present figures for B.C.’s eight economic regions and four largest census metropolitan areas for the first three quarters of 2022. Similarly, monthly housing starts figures provided by Canada Mortgage and Housing Corp. and quarterly residential sales figures from BC Assessment only reflect the year-to-date figures collected to the end of September. As such, those indicators won’t account for economic trends over the final quarter of 2022.
- Annual rental vacancy rates provided by Canada Mortgage and Housing Corp. represent the “primary rental market” or private apartment unit market only. However, the primary rental market rates for three cities on our list were not reported due to unreliable or insufficient data. Therefore, estimates were derived for Sooke from regional figures reported for the Capital Region; for Whistler from values provided for the Whistler Housing Authority’s stock of workforce rental housing; and for Sechelt from an analysis of its total rental stock, advertised rental listings and the performance of its regional peers.