
The province’s top businesses in finance, transport, technology and more
Inflation’s bite brought new corporate leaders to the fore in 2022, while taking the edge off the commodity boom. Here are the largest businesses in the province, organized by industry.

Finance
1. Insurance Corp. of British Columbia
Revenue by fiscal year ($000)
2022: 5,208,692
2021: 6,347,229
2. HSBC Bank Canada
Revenue by fiscal year ($000)
2022: 2,548,000
2021: 2,215,000
3. Canaccord Genuity Group
Revenue by fiscal year ($000)
2022: 2,040,600
2021: 1,993,500
4. PBC Health Benefits Society
Revenue by fiscal year ($000)
2022: 1,768,800
2021: 1,627,985
5. WorkSafe BC
Revenue by fiscal year ($000)
2022: 1,571,000
2021: 4,555,000
6. British Columbia Investment Management Corp.
Revenue by fiscal year ($000)
2022: 937,399
2021: 729,384
7. Raymond James
Revenue by fiscal year ($000)
2022: 705,305 c
2021: 607,948 c
8. Vancity Credit Union
Revenue by fiscal year ($000)
2022: 561,000
2021: 624,500
9. Coast Capital Savings Federal Credit Union
Revenue by fiscal year ($000)
2022: 526,588
2021: 512,035
10. First West Credit Union
Revenue by fiscal year ($000)
2022: 318,462
2021: 343,541
Manufacturing + Transport
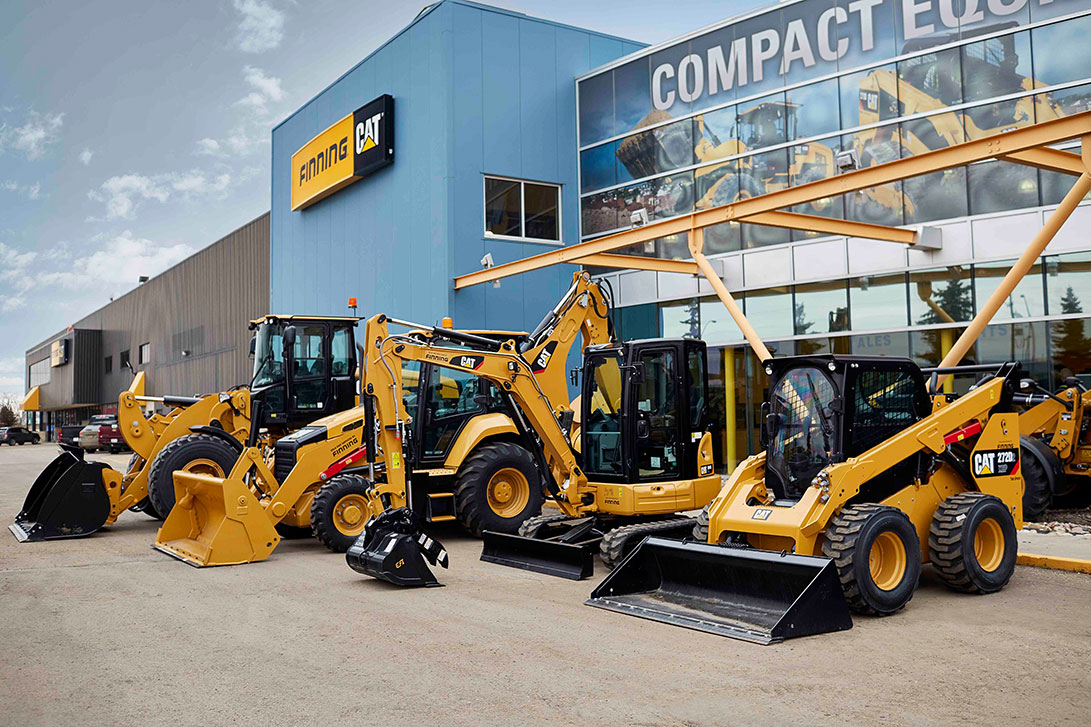
1. Finning International
Revenue by fiscal year ($000)
2022: 9,279,000
2021: 7,294,000
2. Premium Brands Holdings Corp.
Revenue by fiscal year ($000)
2022: 6,029,800
2021: 4,931,700
3. Methanex Corporation
Revenue by fiscal year ($000)
2022: 5,609,904 c
2021: 5,533,650 c
4. Ledcor Group of Companies
Revenue by fiscal year ($000)
2022: 5,000,000
2021: 3,700,000
5. Futura Corp.
Revenue by fiscal year ($000)
2022: 3,300,000
2021: 2,800,000
6. Doman Building Materials Group
Revenue by fiscal year ($000)
2022: 3,039,017
2021: 2,543,674
7. South Coast British Columbia Transportation Authority (TransLink)
Revenue by fiscal year ($000)
2022: 2,138,538
2021: 1,660,651
8. Adentra
Revenue by fiscal year ($000)
2022: 2,103,160 c
2021: 2,025,905 c
9. GCT Global Container Terminals
Revenue by fiscal year ($000)
2022: 1,800,000
2021: 1,602,300
10. Teekay Corporation
Revenue by fiscal year ($000)
2022: 1,548,786 c
2021: 1,708,641 c

Science + Technology
1. Telus International (Cda)
Revenue by fiscal year ($000)
2022: 3,211,608 c
2021: 2,750,179 c
2. Sierra Wireless
Revenue by fiscal year ($000)
2022: 685,738 c
2021: 601,781 c
3. AbCellera Biologics
Revenue by fiscal year ($000)
2022: 631,682 c
2021: 470,317 c
4. Zymeworks
Revenue by fiscal year ($000)
2022: 536,763 c
2021: 33,443 c
5. Stemcell Technologies
Revenue by fiscal year ($000)
2022: 412,307
2021: 325,428
6. BBTV Holdings
Revenue by fiscal year ($000)
2022: 402,335
2021: 476,622
7. Westport Fuel Systems
Revenue by fiscal year ($000)
2022: 397,805 c
2021: 391,593 c
8. Absolute Software Corp.
Revenue by fiscal year ($000)
2022: 256,761 c
2021: 151,403 c
9. Vecima Networks
Revenue by fiscal year ($000)
2022: 186,814
2021: 124,177
10. Aurinia Pharmaceuticals
Revenue by fiscal year ($000)
2022: 174,413 c
2021: 57,166c

Natural Resources
1. Teck Resources
Revenue by fiscal year ($000)
2022: 17,316,000
2021: 12,766,000
2. Paper Excellence Canada Holdings Corp.
Revenue by fiscal year ($000)
2022: 14,184,170 c
2021: 2,000,000 c
3. First Quantum Minerals
Revenue by fiscal year ($000)
2022: 9,923,714 c
2021: 9,040,242 c
4. West Fraser Timber Co.
Revenue by fiscal year ($000)
2022: 9,701,000
2021: 10,518,000
5. Canfor Corp.
Revenue by fiscal year ($000)
2022: 7,426,700
2021: 7,684,900
6. Interfor Corp.
Revenue by fiscal year ($000)
2022: 4,584,045
2021: 3,289,146
7. Mercer International
Revenue by fiscal year ($000)
2022: 2,968,183 c
2021: 2,260,380 c
8. B2Gold Corp.
Revenue by fiscal year ($000)
2022: 2,254,619 c
2021: 2,208,998 c
9. Taiga Building Products
Revenue by fiscal year ($000)
2022: 2,192,705
2021: 2,219,674
10. Pan American Silver
Revenue by fiscal year ($000)
2022: 1,945,077 c
2021: 2,043,205 c

Real Estate
1. BC Housing Management Commission
Revenue by fiscal year ($000)
2022: 1,961,498
2021: 1,903,818
2. Northland Properties Corp.
Revenue by fiscal year ($000)
2022: 1,200,000
2021: 850,000 e
3. Anthem Properties Group
Revenue by fiscal year ($000)
2022: 1,123,780
2021: 713,540
4. Imperial Parking Corp.
Revenue by fiscal year ($000)
2022: 1,100,000 e
2021: 603,675 e
5. Polygon Family of Companies
Revenue by fiscal year ($000)
2022: 617,000
2021: 1,081,000
6. American Hotel Income Properties REIT
Revenue by fiscal year ($000)
2022: 366,143 c
2021: 291,000 c
7. Concert Properties
Revenue by fiscal year ($000)
2022: 325,000
2021: 305,000
8. Wall Financial Corp.
Revenue by fiscal year ($000)
2022: 241,049
2021: 191,558
9. City Office REIT
Revenue by fiscal year ($000)
2022: 234,865 c
2021: 205,625 c
10. BC Pavillion Corp.
Revenue by fiscal year ($000)
2022: 98,647
2021: 82,751

Charities
1. BC Children’s Hospital Foundation
Revenue by fiscal year ($000)
2022: 55,778
2021: 39,480
2. University of British Columbia
Revenue by fiscal year ($000)
2022: 55,044
2021: 36,990
3. Vancouver Foundation
Revenue by fiscal year ($000)
2022: 50,000 e
2021: 58,888
4. BC Cancer Foundation
Revenue by fiscal year ($000)
2022: 44,527
2021: 29,060
5. VGH & UBC Hospital Foundation
Revenue by fiscal year ($000)
2022: 35,906
2021: 25,223
6. St. Paul’s Foundation
Revenue by fiscal year ($000)
2022: 25,390
2021: 17,137
7. Union Gospel Mission
Revenue by fiscal year ($000)
2022: 24,361
2021: 23,570
8. Power to Change Ministries
Revenue by fiscal year ($000)
2022: 20,411
2021: 19,846
9. Terry Fox Foundation
Revenue by fiscal year ($000)
2022: 18,412
2021: 13,545
10. Covenant House Vancouver
Revenue by fiscal year ($000)
2022: 17,464
2021: 17,732

Retail
1. Lululemon Athletica
Revenue by fiscal year ($000)
2022: 10,554,217 c
2021: 7,842,669 c
2. Georgia Main Food Group
Revenue by fiscal year ($000)
2022: 6,150,000 e
2021: 5,700,000 e
3. Best Buy Canada
Revenue by fiscal year ($000)
2022: 5,089,384 c
2021: 4,512,600 c
4. BC Liquor Distribution Branch
Revenue by fiscal year ($000)
2022: 4,355,056
2021: 4,134,673
5. London Drugs
Revenue by fiscal year ($000)
2022: 3,050,000 e
2021: 2,950,000 e
6. Ritchie Bros. Auctioneers
Revenue by fiscal year ($000)
2022: 2,256,204 c
2021: 1,776,173 c
7. Kal Tire
Revenue by fiscal year ($000)
2022: 1,900,000
2021: 1,600,000
8. OpenRoad Auto Group
Revenue by fiscal year ($000)
2022: 1,872,428
2021: 1,817,305
9. Aritzia
Revenue by fiscal year ($000)
2022: 1,494,630
2021: 857,323
10. The Oppenheimer Group
Revenue by fiscal year ($000)
2022: 1,251,000
2021: 1,108,318
e=estimate
c=converted from USD at 1.3013 (2022) and 1.2535 (2021)
Revenue is by fiscal year
DISCLAIMER
BCBusiness prepares the Top 100 list using various sources, but it makes no representation regarding the completeness, accuracy or timeliness of any information presented.